
OUT TO LUNCH
Work for a whole year to make what CEOs get long before lunch on day one

JERI LYNN HORTON IS ROLLING IN DOUGH. So much money that a good hour before lunch on January 2 she had already racked up as much income as any of the folks working in her donut shops will get for working a whole year.
It’s the same for all of Canada’s 100 highest paid CEOs. They each make a lot more than any of the rest of us: 209 times more in 2016 in fact, according to the most recent update on income inequality from the Canadian Centre for Policy Alternatives (CCPA).
CCPA calculations show your average top CEO got to pocket $10.4 million in 2016. Compared to the $49,738 most of us got, on average, for a full year of full-time work.
That means CEOs make at least 316 times more than someone who makes $15 an hour. Worse still, this obscene inequity is an 8% increase for the CEOs over the previous year! And yet Jeri Lynn Horton, and the many millionaire employers just like her, can’t find a way to increase the poverty-level wage they pay to the people who work for them.
All that is bad enough, but consider this: CEOs at the very, very top earn even more.
For example:
- Joseph Papa, CEO at Valeant Pharmaceuticals, gobbled up a whopping $84 million in 2016
- Magna CEO Donald Walker, snagged $28.6 million.
And that’s not all. These super-rich parasites grow their wealth through tax cheating, along with government subsidies to “encourage” investment and outright criminality.
In 2017, Justin Trudeau’s Liberal government spent $840 million on a tax perk they call "stock option deductions" that overwhelmingly benefits the super-rich. The measure allows stock options to be taxed at half the rate of income tax when they are cashed in. Stock options are often paid instead of a salary for top CEOs.
Another CCPA study found that 75 of the top 100 CEOs in Canada received stock options as part of their salary in 2015. Take Hunter Harrison, of Canadian Pacific Railway, for example: his regular salary was sweetened with $5.2 million in stock options.
Differences between top and bottom earners

- As income became more concentrated among the top earners in Canada, the lower half of income earners saw their share of earnings decrease
- From 1982 to 2014, the proportion of market income earned by the bottom half of earners fell by 28%.
- Meanwhile, the share earned by the top half increased by 5%.
- The largest gains were made in the highest earning brackets.
- The top 1% saw their share of income rise by 53%, the top 0.1% by 90% and the top 0.01% by 133%.
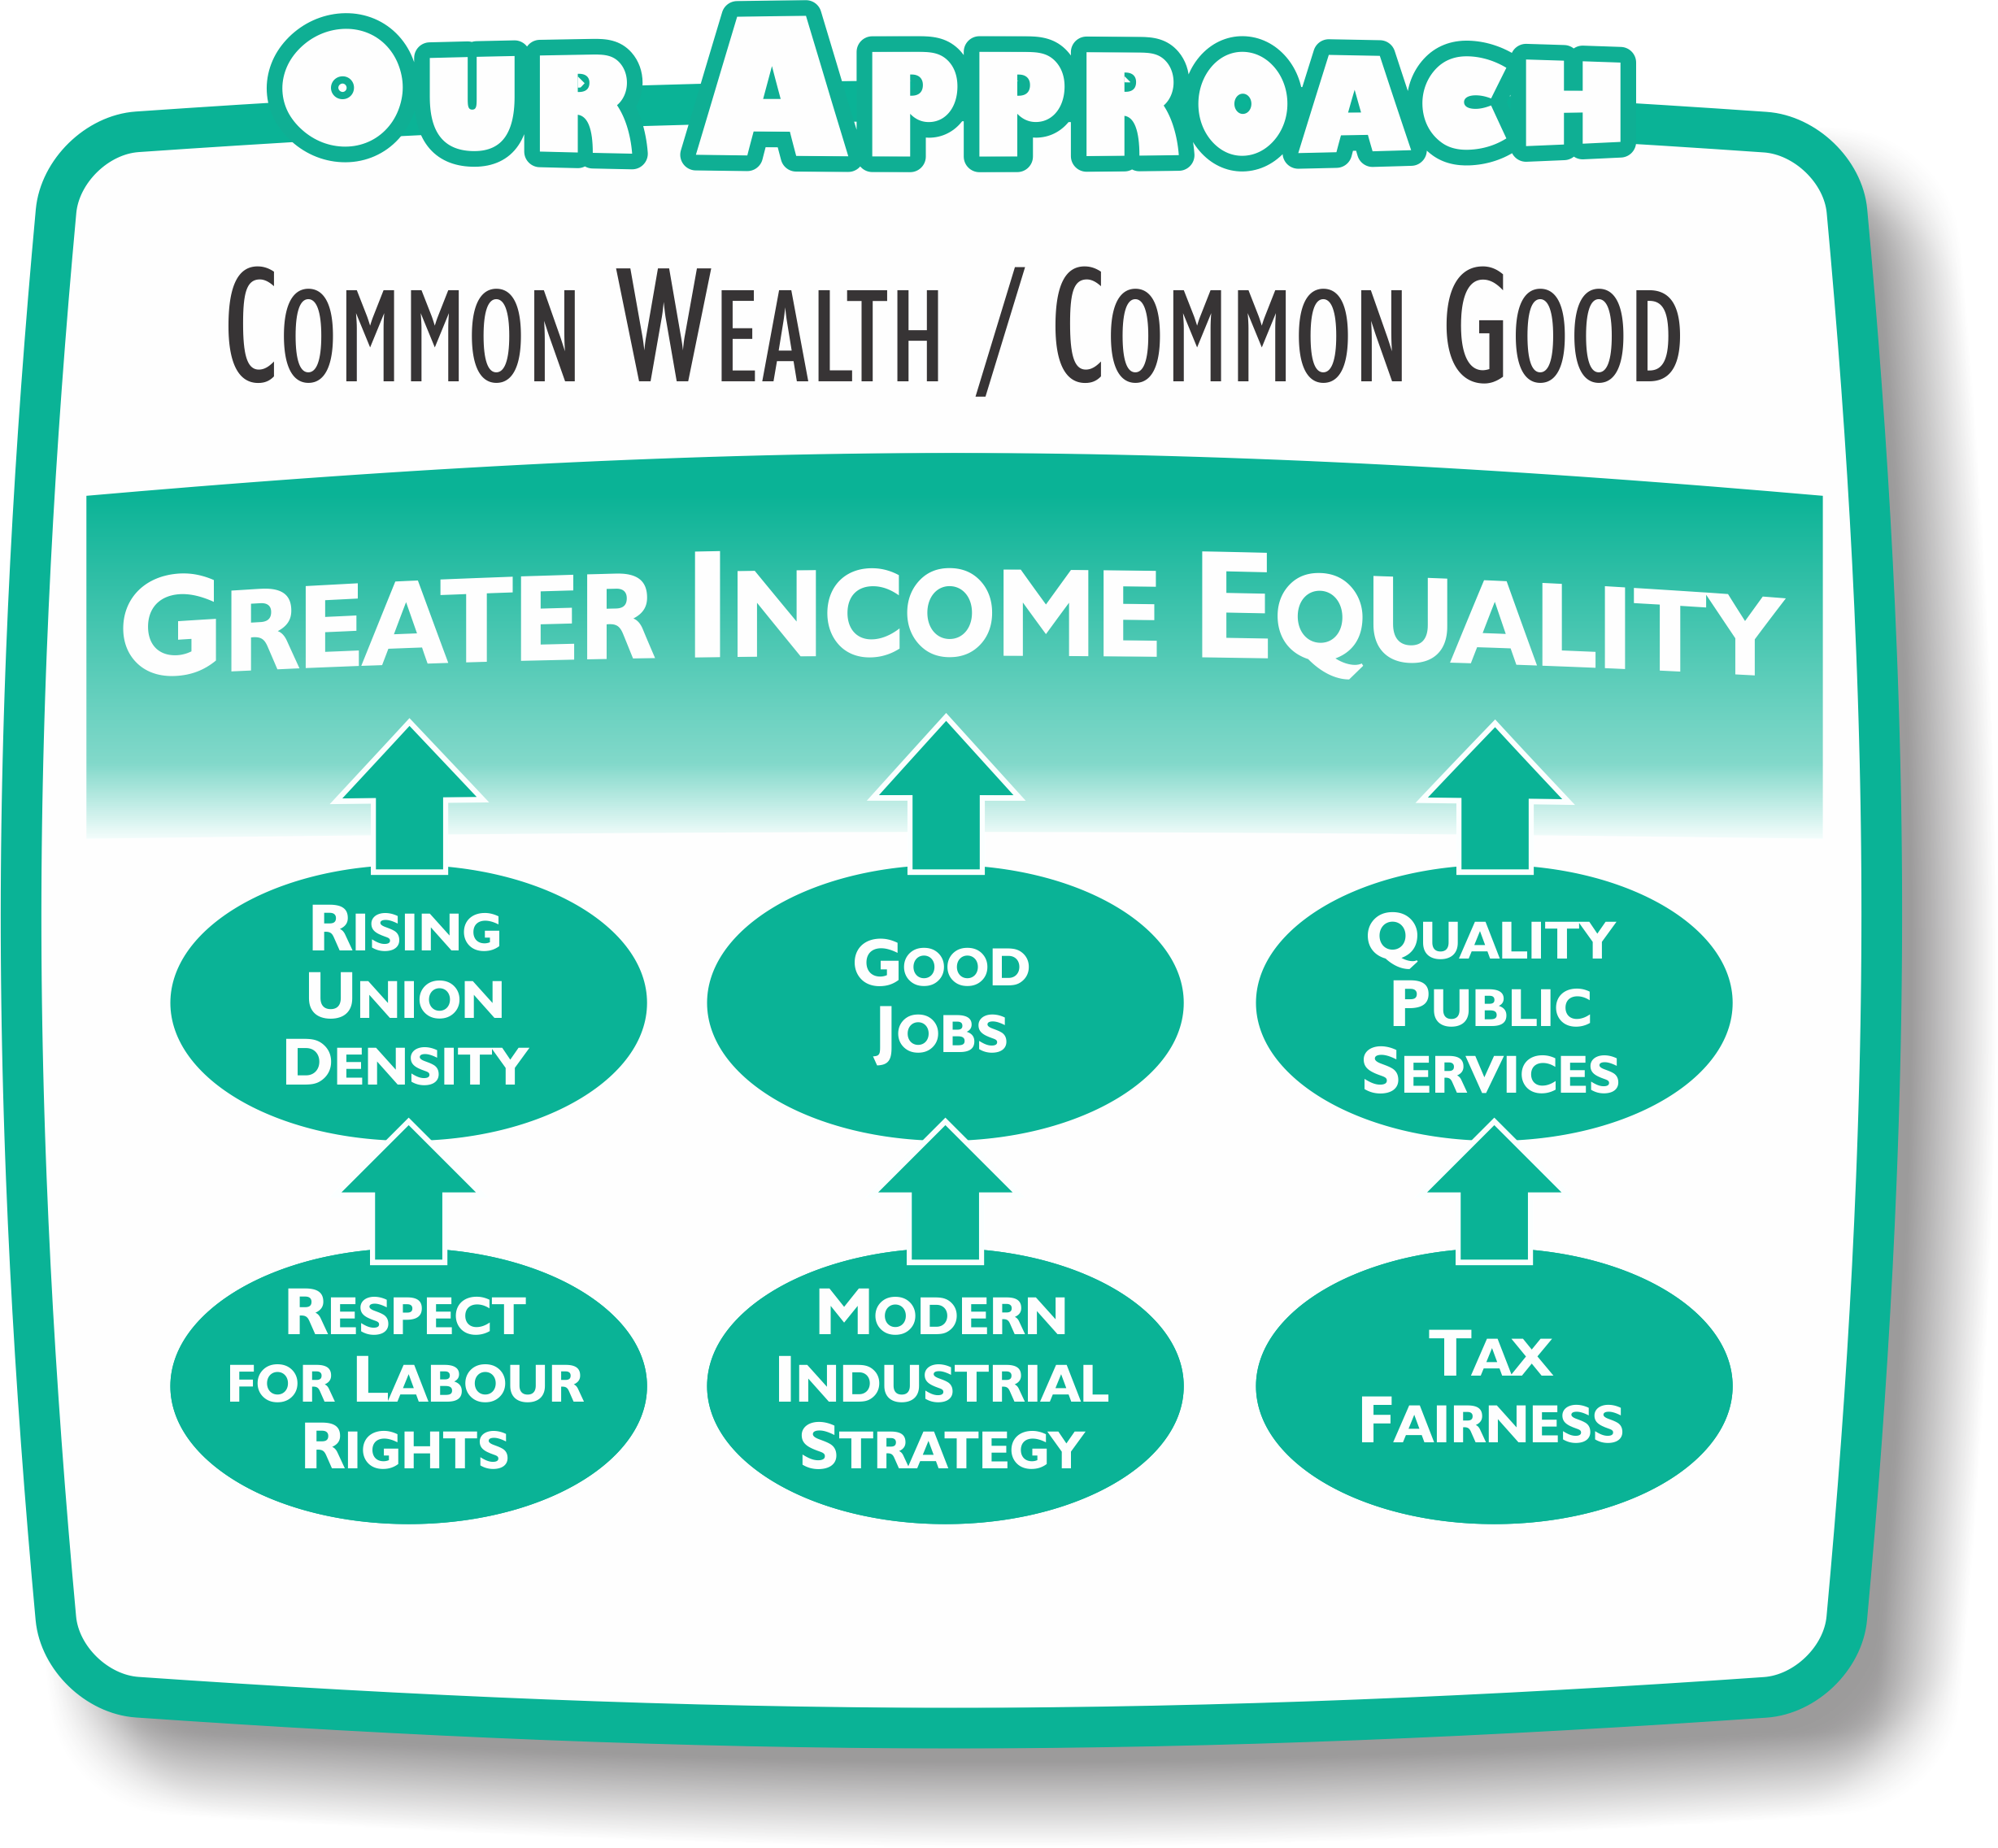
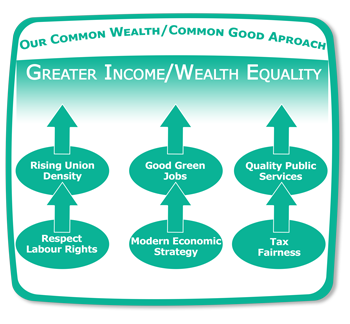
What we can do about it
Help organize workers by spreading the word. The recent outrageous actions by Tim Horton’s and other businesses has proven that thousands of workers are outraged at the current state of affairs and ready to fight back. If your not a member already, join an organization fighting pay inequality and for workers rights.
- 30 -


Add new comment